A Beginner’s Guide To Reading And Analysing Crypto Charts

Crypto investors use crypto charts to assess the market of various cryptocurrencies before going ahead with their investments. These charts graphically represent the historical volumes, prices and time intervals of various cryptocurrencies. If you want to enter the crypto world, knowing these patterns and learning how to conduct a technical analysis can help you spot lucrative investment opportunities.
Read on to learn what are crypto charts in detail, their importance and how to read them.
What are Crypto Charts?
Crypto charts are a combination of lines and candlestick patterns that indicate a coin’s historical performance. These charts can help you forecast future trends in the market, allowing you to make informed investment decisions.
In other words, these charts are a snapshot of a crypto’s historical and current price movements over a specified period. This duration can range from seconds to minutes or even months to years. These charts might appear too technical to understand for a first-time investor. Thus, it is crucial to understand the basic terms related to cryptocurrency charts.
What are Japanese Candlestick Charts?
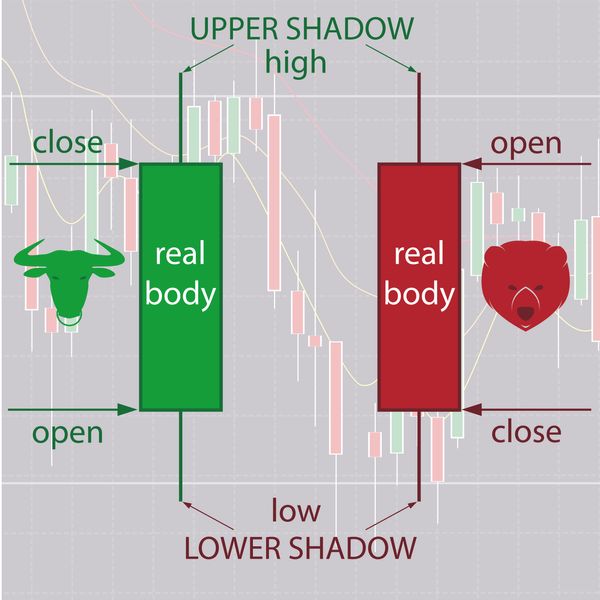
The Japanese candlestick chart is the second-most used form of the crypto chart after line charts. Most analysts favour the Japanese candlestick patterns because of the added data they provide. In this chart, candles are specifically of two colours – green and red.
A red candle indicates that the closing price of a particular crypto was lower than its opening price. This simply indicates that the asset’s price fell over a time frame. On the other hand, a green candle depicts a rise in an asset’s price over a specific period.
Furthermore, the shape, size and colour of these candles, including their patterns, can indicate a coin’s future price action. This allows investors to take a favourable position and change their strategies accordingly.
You can obtain substantial information about a crypto coin through a single candle if you know Japanese candlestick charting techniques. That said, pairing particular candles together provides an accurate prediction of a crypto’s future price movements. These can be classified into two types:
- Bearish reversal patterns
- Bullish reversal patterns
Some of the most common signs of bullish reversal patterns include:
- Hammer candle pattern
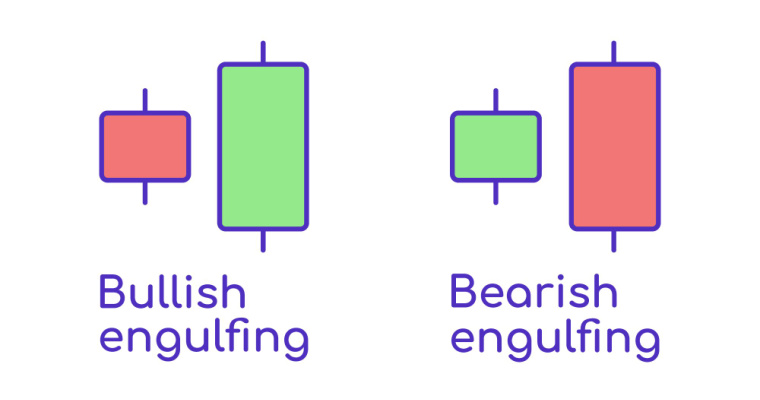
- Bullish engulfing candle pattern
- Morning star candle pattern
A few examples of bearish reversal patterns are:
- Bearish engulfing candle pattern
- Shooting star candle pattern
- Evening star candle pattern
Also Read: What Is Crypto Market Cap And Why Is It Important?
Importance of Technical Analysis
As a trader, you can utilise technical analysis to predict the upcoming price movements of an asset as per market data. You can do this by drawing lines on the tops and bottoms of the candles in crypto charts. This can also be done across support and resistance to create shapes, which will later be utilised to predict price action.
Using these techniques helps investors notice different market trends and predict the future price of an asset. This assists one in deciding whether to buy or sell a particular crypto asset.
Common Chart Patterns for Technical Analysis
Cryptocurrency graphs or chart patterns for technical analysis can help you predict the future price action of a coin. That said, here are a few commonly used chart patterns that indicate crypto price movements.
- Head and shoulders: These reversal patterns might emerge at a trend’s peak or bottom. If they emerge near a trend’s bottom, they are referred to as the inverted head and shoulders chart pattern. These patterns specifically display a clash between buyers and sellers, where one side is clearly engulfing another. This results in a massive push or pullback of crypto coins.
- Triangles: These are steadily tightening patterns, featuring a sloping top or bottom during a certain timeline. In case the opposing trendline is flat, the pattern is described as a descending or ascending triangle. These are mostly observed during a pause in a prevailing trend.
- Wedges: They depict a trend losing momentum, which eventually causes a breakdown in the direction opposite to the dominant market trend. Markets that move sideways indicate a back-and-forth wedge until it proceeds in a specific direction.
Other Crypto Chart Technical Indicators
Apart from the patterns mentioned above, a few other technical indicators can help determine the market’s position and current price movements of digital assets. Here’s a closer look at them:
- On-Balance Volume Indicator (OBV): It specifically focuses on a crypto’s trading volume. OBV is an unstable indicator, which fluctuates depending on a timeline’s trading volume. You can also use OBV to confirm trends. For instance, if you witness fluctuations in OBV while looking at cryptocurrency live charts, it means the prices are being influenced by an ongoing trend.
- Moving Average Convergence Divergence (MACD): The moving average convergence divergence is often regarded as a lagging indicator. It employs two diverging and converging moving averages to depict if an asset is oversold or overbought. Moreover, the two lines in this pattern indicate momentum. Thus, if they cross over or one goes under the other, it means there has been a shift in trend.
- Relative Strength Index (RSI): This indicator depicts whether an asset is overbought or oversold. It is a type of oscillator that might vary between 0 and 100. You can deem a cryptocurrency as oversold if the value falls below 30 and overbought when it rises over 70. In such a case, overbought indicates ‘sell’, whereas oversold indicates ‘buy’.
- Bollinger Bands: Created by John Bollinger, this indicator can help you determine short-term price movements. When it comes to Bollinger bands, it is crucial to know that the high volatility period is followed by a low volatility period. That said, when the bands stand closer, it indicates high volatility. On the other hand, when bands stay separated during periods of high volatility, it might indicate that the trend may end soon.
Cryptocurrency Market Cap Chart
The market capitalisation of cryptocurrencies is the total value of the digital currencies that are being traded in all the digital assets trading platforms. Crypto charts that indicate the entire industry’s market cap are an indispensable tool for understanding the market sentiments of the entire crypto industry.
The cryptocurrency market cap charts indicate the percentage of market share that each cryptocurrency holds. As of now, Bitcoin is the largest crypto globally as per its market cap. Ethereum follows this giant coin. Properly studying the crypto market cap charts can help you determine the top cryptos in the world, enabling smarter trading decisions.
Also Read: What Is A Crypto Mining Rig And How To Build One?
Final Word
The various crypto charts mentioned above can help traders form a conclusive trading plan. While these indicators might help you understand the market sentiment, you must always remember to choose an efficient trading platform and follow a disciplined trading strategy.
FAQs on Crypto Charts
Ans: A support level in a crypto chart indicates a moment when a cryptocurrency starts falling. Traders often consider buying during such a situation. Meanwhile, resistance is simply the opposite of support. This is when an asset’s value stops increasing. This is when many traders consider selling.
Ans: Major market trends feature three phases. They are:
Accumulation: This is when knowledgeable traders buy or sell a coin in an attempt to go against the general market perceptions.
Public participation: This is also called the absorption phase, when the remaining market follows the knowledgeable participants.
Distribution: In this phase, knowledgeable investors distribute their holdings to the market.
Ans: Dow Theory talks about market trends and how they can behave at a high level. This theory offers signals that traders can use to understand the primary market trend. Upon that, they can use their understanding to make trading decisions.
Ans: Moving averages are one of the most popular technical indicators. They help generate an average price for a particular cryptocurrency. You can adjust this indicator to time periods and receive useful signals when trading with live crypto charts.
Ans: In simple terms, a bull market begins when assets are on the rise. On the other hand, in a bearish market, cryptos tend to fall for a sustained period. During a bull market, traders start buying coins, whereas they sell their assets when the bear market arises.
Before you go…
- Looking for instant 🚀 personal loans 24*7 anywhere, anytime? Get personal loans up to ₹20 lakh starting at 9.9% p.a. Install the Navi app now!
- Or, maybe you’re looking to buy that house you’ve been eyeing 🏠 and you need a loan of up to ₹5 crore. Install the Navi app now and get instant in-principle approval right away! Interest rates starting at 8.60% p.a.
- How about an affordable health insurance policy 👨⚕️ starting at a monthly premium of just ₹235? Install the Navi app now and get your policy in under 2 minutes.
- Instead, want to put your savings into action and kick-start your investment journey 💸 But don’t have time to do research. Invest now with Navi Nifty 50 Index Fund, sit back, and earn from the top 50 companies.
Disclaimer: Crypto products and NFTs are unregulated and can be highly risky. There may be no regulatory recourse for any loss from such transactions.
Mutual Fund investments are subject to market risks, read all scheme-related documents carefully.
This article has been prepared on the basis of internal data, publicly available information and other sources believed to be reliable. The information contained in this article is for general purposes only and not a complete disclosure of every material fact. It should not be construed as investment advice to any party. The article does not warrant the completeness or accuracy of the information, and disclaims all liabilities, losses and damages arising out of the use of this information. Readers shall be fully liable/responsible for any decision taken on the basis of this article.