What is Regression Analysis – Types, Interpretation and Limitations

Regression analysis is a statistical method that shows how a dependent variable acts due to changes in various independent variables. In business, regression analysis helps analyse how independent factors like changes in customer preferences, weather conditions, and changes in prices will affect sales (that is the dependent factor). In finance, it is a part of other financial tools, such as the Capital Asset Pricing Model, which helps in determining the expected return on your investments.
Here’s an easy guide to regression analysis – how it works, its types, how to interpret it, how companies use it and its limitations. Read on!
How Does Regression Analysis Work?
Regression analysis is frequently used to create models on datasets that successfully predict the values of the dependent variable. The dependent variable is depicted by ‘y’, whereas the independent variables are written as ‘x’. Here, the dependent variable is also known as the outcome variable.
You can start by dividing a dataset into two categories – a training dataset and a testing dataset. The training dataset is used to build a line of best fit on the graph. It can be a straight line or a curve.
The testing dataset’s dependent variable may be predicted using this line. The regression value is then calculated. This can be done using methods such as the R-squared method, root mean square error, root mean average error, Pearson correlation coefficient, and others.
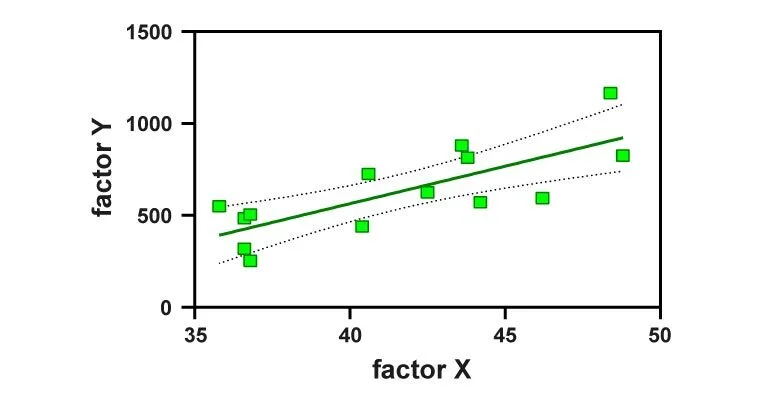
The graph depicts the various possibilities as dots on the graph. How close these dots are to the best-fit line and how they are dispersed indicates the level of regression.
There are various types of regression analysis, including linear, multiple linear, and nonlinear. Let us understand them in detail.
Types of Regression Analysis
The following are the types of regression analysis:
1. Linear Regression
Simple linear regression establishes the relationship between two variables – a dependent variable and an independent variable. The following is the equation used to calculate simple linear regression:
Y = a + bX + ϵ
Where:
Y is the dependent variable
X is the independent variable
a is the y-intercept
b is the slope of the line
ϵ is any residual figure or error
2. Multiple Regression Analysis
Multiple linear regression analysis is mostly the same as the simple linear model, apart from the fact that here, several independent variables are used. Multiple linear regression is mathematically represented as follows:
Y = a + bX1 + cX2 + dX3 + ϵ
Where:
Y is the dependent variable
X1, X2, and X3 are the independent variables
a is the y-intercept
b, c, and d are the slopes of the lines
ϵ is the residual that is left or any error
The basic linear model and multiple linear regression follow the same rules. However, the multiple linear regression model is required, as in reality, several independent variables are present in the environment.
3. Nonlinear Regression
Nonlinear regression involves fitting data to a model before expressing the result as a mathematical function. While simple linear regression establishes a straight-line relationship between two variables, nonlinear regression shows a relationship between the two variables in the form of a curved line.
A simple nonlinear regression model is expressed as follows:
Y = f (X, β) + ϵ
Where:
X is a vector of P predictors
β is a vector of k parameters
f shows the regression function
ϵ is the error term
These are the major types of regression analysis models.
Also Read


What are the Error Terms in Regression Analysis?
One important thing to keep in mind when analysing the results of regression is that despite a correlation between two variables, one may not be the sole cause of the other. For instance, assume that we are analysing the relationship between sales of clothes and a change in season. An increase in sales may or may not be an outcome of the season change, despite there being a correlation between the two. It could be that the increase in sales is due to more expenditure on visual ads or even a clearance sale during the same period.
Because of this, we take into account an error factor. It is used to determine the accuracy of the regression and how closely one variable affects the other. In general, a higher error factor means the reliability of the regression line is low.
To avoid errors, regression analysis frequently includes several variables. By doing so, the likelihood of discovering the real reason for the change in variable increases. This indicates that extensive market research is necessary for the company.
How to Interpret a Regression Model?
The goal of linear regression analysis is to examine the relationship between one independent and one dependent variable. One way to get the analysis in absolute terms is to calculate the coefficient of regression. This is depicted as ‘b’ and can be calculated as follows:
bxy = r * (standard deviation of x / standard deviation of y)
Here, bxy shows the coefficient of regression of x over y, and r is the coefficient of correlation.
Similarly, the coefficient of regression of y over x can be calculated as:
byx = r * (standard deviation of y / standard deviation of x)
The value of the regression coefficient indicates the size of the change that the independent variable will bring on the dependent variable. If there is a positive coefficient of regression, it shows how much the dependent variable will increase due to the independent variable. Similarly, a negative coefficient of regression shows how much it will decrease.
How Do Companies Use Regression Analysis?
1. To Explain a Phenomenon
This might involve looking for a cause for things like why sales are more on particular days of the month, why more people buy coffee on certain days, or why stock gets cleared faster during a particular period. The possibilities are endless.
2. To Predict Future Requirements
Regression analysis predictions can encompass a wide range of circumstances and scenarios. This can help the companies plan advertising campaigns by estimating how many customers may engage with them. They can also predict the demand for a product in the coming months based on past patterns and increase the production capacity accordingly.
3. To Bring in a Fresh Perspective
Companies store a lot of data that can help determine customer behaviour and patterns. Analysing this data helps companies bring a fresh perspective to their approach, help them fill gaps in existing methods, and also bring to light facts that may go unnoticed otherwise.
Challenges With Regression Analysis
Correlation is not the same as cause. Any two variables can be shown to be related. But, this does not always imply that one of the variables is the cause of the other. Some individuals believe that the presence of a positive link in a regression analysis proves cause and effect. Regression analysis, however, simply demonstrates the connection between variables, not cause and effect, as we have already established.
Here are the mistakes you must avoid while undertaking regression analysis:
1. Not Doing Enough Research Before Beginning
Regression analysis depends on the data that you input into the calculations. Thus, the accuracy of the result depends primarily on the accuracy of the data. The more you research, the wider your database will be. This will help you cover a larger range of possibilities.
2. Using Very Complex Models
There are a large number of factors that affect a particular variable. However, if you start taking all of them into account, the result of the regression analysis may become messy and difficult to interpret. Even undertaking the analysis will become more challenging. A maximum of three variables must be preferred.
3. Depicting the Data in Only One Way
There are various ways of showing the regression analysis results, including graphs, charts, and tables. You can understand the results better by displaying them in various formats. This is because a particular point may go unnoticed in one format and can be caught when data is presented differently.
Final Word
Regression analysis provides an excellent way of analysing data and seeing the effects of different variables on one variable. While it may seem like a complicated way of analysing situations, it gives a clear picture by quantifying different situations. You can use many different forms of regression analysis, depending on the number of variables you want to analyse.
FAQs
Ans: You can use regression analysis to explain the link between a group of independent factors and the dependent variable.
Ans: You can use multiple linear regression to find the relationship one dependent variable has with multiple independent variables.
Ans: The results of regression analysis show the relationship between changes in each independent variable and the dependent variable.
Ans: You must determine the precise function of each variable while undertaking the regression analysis for accurate results.
Ans: The regression analysis allows you to keep the other independent variables constant by simply incorporating them into your model. It makes calculations simpler, allowing you to get a more accurate result.