
Multiple Linear Regression (MLP) – Uses, Formula and Examples
Various statistical models help in establishing a relationship between different variables. Multiple linear regression is a statistical model that describes the functioning relationship between one dependent variable and two or more independent variables. This kind of statistical interpretation helps make predictions and acts as a guide to key decisions.
Read on to learn more about this concept and its different working aspects.
What is the Formula of Multiple Linear Regression?
The multiple regression formula is as follows:
yi = β0 + β1xi1 + β2xi2 + ……… + βpxip + ϵ
For i= n observations
Whereby yi represents the dependent variable;
xi represents the explanatory variables;
β0 represents the constant term or y-intercept;
βp represents slope coefficient for every explanatory variable;
ϵ represents any model error or residual term.
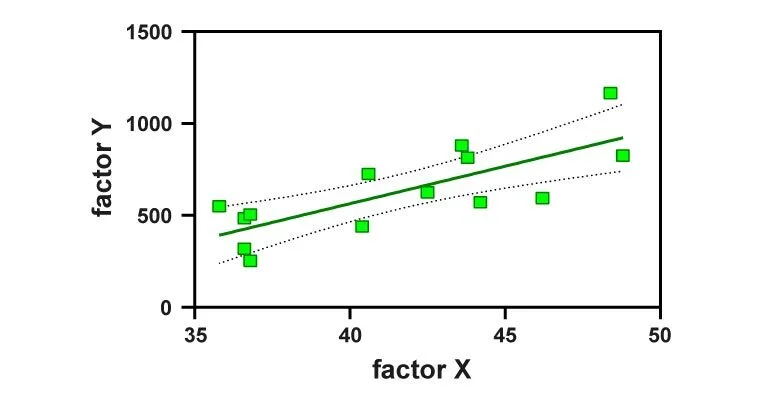
Using all the data as mentioned in the formula, you will get to know the value of a dependent variable with respect to the independent variable. On plotting these values on a graph, you will see a linear relationship between them.
How to Calculate Multiple Linear Regression?
Here are some steps that you can follow to get multiple regression model values:
Suppose there is one dependent variable named y, and there are two independent variables, namely x1 and x2. There are data sets available for all three variables.
Step 1: Compute x12, x22, x1*x2, x1*y, x2*y.
Step 2: Calculate the summation of all these variables.
Step 3: The next step entails calculating β0, β1, and β2, respectively, by using the summation calculated in the previous step.
Step 4: Place all the variables in multiple regression line formula to establish the relationship between y and x1 and x2.
Also Read


Example of Multiple Linear Regression
Let’s understand the working of this concept more clearly with the help of an example:
Let’s say the values of X1 are 2, 4 and 5; the values of X2 are 1, 3 and 6.
Meanwhile, values of Y are 10, 12, and 14.
So, the mean value of X1 = 3.66; mean value of X2 = 3.33, and Y = 12
Sum of squares of X1 = 15, X2 = 15.33.
The sum of products X1Y = 24; and X2Y = 12 and X1X2 = 32.66
The regression equation is y = β0 + β1X1 + β2X2. Using the formula,
we get β0 = 5.6254, β1 = -.02365 and β2 = 7.259.
By putting all these values in the formula, multiple regression comes out as:
Y = 5.6254 – 0.2365X1 + 7.259X2.
Therefore, as seen from this example, we can easily establish a relationship that exists between the dependent and independent variables by looking at the graphical representation of the values mentioned above.
What Are the Assumptions of Multiple Linear Regression Model?
Every statistical model works on certain assumptions; the multiple linear regression model also works on some assumptions, which are as follows:
1. Constant Variance
There is a constant variance of ϵ for all the datasets of Xs. Therefore, we can analyse the residual plots of X’s to get an idea of this variance. Moreover, a rectangular residual plot indicates constant variance. However, if the residual plots have a wedge shape, it means non-constant variance.
2. Linearity
Another assumption about this model that one should know is linearity. A straight line relationship exists between the variables X and Y. Any curvilinear relation is not considered. You can visually see a linear pattern through the scatter plots. However, residual plots may show some non-linear patterns as well.
3. Multicollinearity
There exists a linear relation between various sets of independent variables. Therefore, it indicates multicollinearity among these variables. However, as multicollinearity causes several difficulties with regard to regression analysis, we assume that respective datasets of independent variables are not multi co-linear.
4. Normality
The confidence limits, as well as hypothesis tests, show a normal distribution of residual value, i.e., ϵ.
How to Use Multiple Regression Analysis Model?
This analysis is quite useful when more than one factor affects a particular variable. For example, by looking at this model, we can get an idea about what factors are affecting sales figures or price changes of a newly launched product.
This also helps businesses to better plan their projects or product launches by understanding various factors involved and the relationship between them. It may be very helpful for long-term outlook or projections made by a business or firm.
Individual professionals also use this during research analysis. Therefore, we see that the regression model has several uses for businesses and individuals. One can get a better idea about the behaviour of datasets by looking at the regression line.
Final Word
Multiple linear regression is a quite popular statistical tool that helps in establishing relationships between dependent and independent variables. It is quite useful in the analysis of research and future planning. Although multiple regression analysis can get quite lengthy and complicated, it offers a better result when compared to other statistical tools.
FAQs
Ans: Multiple regression analysis is a wider concept as it deals with two or more two independent variables and their relationship with dependent variables. On the other hand, linear regression deals with only one independent variable. It exhibits a relationship between one independent variable and a dependent variable.
Ans: This model works for a number of independent variables. When there are two or three independent variables, you can do a regression analysis by hand. However, as variables increase and the complexity associated with them also increases, it becomes difficult to manually calculate the regression analysis. In this scenario, you need to use either Excel or specialised software.
Ans: It helps in forecasting or anticipating the response variable. This will be beneficial for planning and monitoring purposes. For example, individuals can analyse the sales, revenue generation, delivery and turnaround times, etc., by implementing multiple regression analysis.
Ans: There are several types of multiple regression models, such as standard model, hierarchical model, stepwise model, and set wise model. The type of model to be used depends on the question of interest of the researcher.