What is Harmonic Pattern and How Does it Help in Trading?
Harmonic patterns are one of the most efficient and effective trading patterns. Although they are more complex than other patterns, they can assist technical analysts in interpreting more price action information in the markets. There are several harmonic patterns, each of which may be utilised to identify a specific type of trend.
Read on to find out more about harmonic patterns in detail!
What are the Various Harmonic Trading Ratios?
Primarily, there are 3 harmonic trading ratios as given below:
- Primary Ratios
- Primary Derived Ratios
- Complementary Derived Ratios
1. Primary Ratios
- Primary Ratio = 0.618
- Primary Projection = 1.618
2. Primary Derived Ratios
- Square root of 0.618 = 0.786
- Square root of 0.786 or the Fourth root of 0.618 = 0.886
- Square root of 1.27 or the Fourth root of 1.618 = 1.130
- Square root of 1.618 = 1.270
3. Complementary Derived Ratios
- (1 – 0.618) or 0.6182 = 0.382
- 0.7702 = 0.500
- Square root of 0.50 = 0.707
- Square root of 2.0 = 1.410
- 1 + 1 = 2.000
- Square root of 5 = 2.240
- 1.6182 = 2.618
- Pi = 3.141
- 1 + 2.618 = 3.618
Harmonic trading uses patterns and math to create a precise trading system based on the concept that patterns repeat themselves. The primary ratio, or any derivative of it, is at the heart of the technique (0.618 or 1.618). The following ratios are complementary: 0.382, 0.50, 1.41, 2.0, 2.24, 2.618, 3.14, and 3.618.
The primary ratio can be found in nearly all environmental structures and occurrences, as well as man-made structures because the pattern repeats across nature and society; the ratio can also be found in financial markets, which are influenced by the setting and society that they operate in. Traders can use Fibonacci ratios to forecast possible movements after identifying patterns of varying lengths and magnitudes.
Also Read

Example of Harmonic Patterns

Source: YouTube https://www.youtube.com/watch?v=OW6vJB074EI&t=455s&ab_channel=HarmonicTrading
Types of Harmonic Patterns
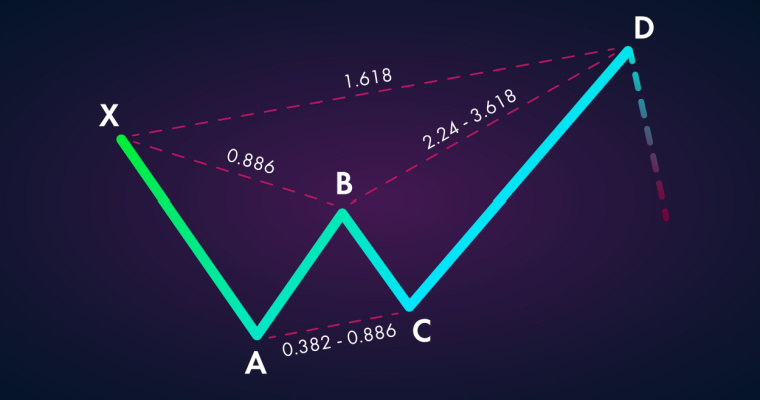
1. Butterfly Pattern
The butterfly harmonic pattern is a type of reversal pattern that appears towards the end of a trend move. It was created by Bryce Gilmore and consists of five points: X, A, B, C, and D. The pattern can take two forms: bullish butterflies, which signal when traders should buy, and bearish butterflies, which suggests when the traders should sell. Butterfly patterns assist traders in predicting the end of a current trend so that they can enter or exit the trade.
The rules for butterfly pattern are as follows:
- The Butterfly pattern’s most significant level is the B point, which should retrace 78.6% of the XA leg.
- The BC move should retrace the AB move at either 38.2% or 88.6%.
- If BC is 38.2% of AB, CD is likely to reach BC’s 161.8% extension. CD, on the other side, is likely to reach the 261.8% extension of BC, if BC is 88.6% of AB.
- D must be either 127.0% or 161.8% extension of XA. Point D is referred to as the ‘Potential Reversal Zone (PRZ).

Source: Forex Academy
2. Bat Pattern
The Bat pattern was found in the early 2000s by Scott Carney. The Bat pattern, similar to the Gartley pattern, is a retracement and continuation pattern that occurs when a trend briefly reverses direction but then resumes its original direction. This pattern enables traders to enter a trend at a good price.
The following are the primary rules of the bat pattern:
- The AB leg can retrace between 38.2% and 50% of the XA leg.
- The BC leg can retrace between 38.2% and 88.6% of the AB leg.
- The CD leg can retrace up to 88.6% of the XA leg.
- The CD leg can also be a 16.18% – 26.18% extension of the AB leg.

Source: Harmonic Trader
3. Gartley Pattern
The Gartley pattern is a basic harmonic pattern that is preceded by a strong low or high. Harold McKinley Gartley developed this pattern in 1935. It is also known as the ‘222’ pattern because it is detailed on page 222 of his book, ‘Profits in the Stock Market’. Gartley patterns typically occur when the overall trend is being corrected. Bearish Gartley patterns resemble an ‘M,’ whereas bearish patterns are W-shaped.
The following are the rules for a harmonic pattern to be labelled a Gartley pattern:
- The AB movement should be about 61.8% of the size of the XA movement. As a result, if the XA movement is bullish, the AB movement should reverse the price action and reach the 61.8% Fibonacci retracement of the XA move.
- The BC move should then be the inverse of the AB move. In addition time, the BC move should finish on either the 38.2% or 88.6% Fibonacci level of the previous AB leg.
- The CD movement should be the inverse of the BC movement. If BC is 38.2% of AB, CD should respond to a 127.2% extension of BC. If BC is an 88.6% extension of AB, then CD must be a 161.8% extension of BC.
- CD move should be a 78.6% retracement of the XA move.

Source: Forex Academy
4. Crab Pattern
Scott Carney created this pattern, which he claims is one of the most effective harmonic patterns to utilise while trading. It is a trend reversal pattern with four legs labelled X-A, A-B, B-C, and C-D.
As per Carney, one of the key advantages of adopting the Crab pattern over other types of harmonic patterns is the high risk/reward ratio because these setups allow for very tight stop losses. It allows traders to enter the market at extreme lows or highs.
The crab design is similar to but much more condensed than the butterfly pattern. This allows for the capture of smaller and tiny price movements.
Crab patterns must conform to the following rules:
- AB is a counter-trend move in comparison to the previous leg, retracing 38.2% – 61.8% of XA
- BC retraces 38.2% to 88.6% of AB.
- CD is 26.18% to 36.18% of BC.
- Point D is 16.18% XA’s extension.

Source: Harmonic Trader
5. Cypher Pattern
The cypher harmonic pattern consists of five touch points separated by four waves or legs. Every touchpoint indicates a reversal level, and each leg indicates a price action. It employs tighter Fibonacci ratios (often fewer than 1), resulting in a steeper look.
Cypher patterns must conform to the following rules:
- AB retraces between 38.2% – 61.8% of XA
- Point C extends beyond A by 12.72% – 14.14%
- Point D does not extend beyond point X by more than 78.6%


Source: Forex Training Group
How to Enhance Trading Strategy by Harmonic Patterns?
Harmonic patterns are rather accurate at forecasting price direction in almost any timeframe. In order to increase their accuracy even further, it is essential to read the harmonic chart patterns properly while taking into consideration the current price, trend, volatility, and, most importantly, market sentiments.
Pattern efficiency can also be increased by combining additional technical analysis techniques. Oscillators, such as RSI, along with support and resistance lines, in particular, can assist in validating the buy/sell signals created by harmonic patterns.
Finally, in order to get the most benefit from harmonic trading, it is crucial to constantly exercise reading and spotting patterns accurately.
Also Read

How to Trade Harmonic Patterns?
Depending on the pattern that forms, harmonic patterns can help recognise:
1. Reversal Patterns
These indicate that the prices will reverse and go in the opposite direction.
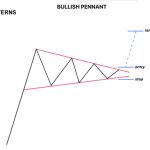
2. Continuation Patterns
These predict that the prices will keep moving in the same direction.
Furthermore, these patterns can either be:
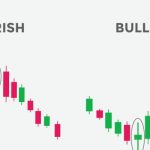
- Bullish harmonic pattern (indicating a price increase) or
- Bearish harmonic pattern (indicating a price decrease)
Navigating and analysing these patterns properly can therefore help one make proper investment and trading decisions accordingly.
Advantages of Harmonic patterns
- Harmonic indicators are extremely reliable and produce highly probable profit settings for the trader.
- Since they are based on the Fibonacci ratios, trading rules are highly standardised.
- These patterns work across all timeframes and market instruments
- Other indicators, such as RSI and MACD, can be used in conjunction with these to yield better results.
Disadvantages of Harmonic patterns
- Harmonic pattern recognition and automation (coding) are tough.
- Contradicting Fibonacci retracements/projections can make finding reversal or projection zones challenging.
- These patterns are complex and difficult to understand
Final Word
The primary idea underlying harmonic patterns are the price/time movements that follow Fibonacci ratio relationships and market symmetry. Fibonacci ratio analysis is applicable to any market and period chart. The fundamental idea behind employing these ratios is to detect significant turning levels, retracements, and extensions, as well as a chain of swing high and swing low points. The predictions help provide crucial price levels for targets and stops. Therefore, these are precise and quantitative ways to trade, but mastering the patterns takes time, experience, and a lot of research, as movements that do not line up with the correct pattern measurements invalidate the pattern and might lead traders astray.
FAQs
Ans: Harmonic patterns trading involves chart patterns that can assist traders in identifying pricing trends by estimating future market movements. They build geometric price patterns using Fibonacci numbers to identify potential trend reversals or price shifts. Traders can identify these trends and utilise them to guide their next trade.
Ans: The different types of harmonic patterns include the Butterfly, Gartley, Bat, Crab and Cypher.
Ans: All harmonic patterns help recognise if the prices are going to reverse or continue in the same trend (bullish or bearish). This information, along with other indicators such as RSI and MACD, can help one make sensible trading decisions.
Ans: Technical traders often use the Fibonacci retracement, a tool based on key numbers to determine price levels for buy or sell orders, stop losses or target prices. In the 12th century, an Italian mathematician named Leonardo Pisano Bigollo, also known as Fibonacci, discovered the Fibonacci numbers.
Ans: PRZ, or Potential Reversal Zone, is the area where prices have a very high chance of going through a trend reversal and hence serve as a good entry/buy point.
Want to put your savings into action and kick-start your investment journey 💸 But don’t have time to do research? Invest now with Navi Nifty 50 Index Fund, sit back, and earn from the top 50 companies.
Disclaimer: Mutual Fund investments are subject to market risks, read all scheme-related documents carefully.
This article has been prepared on the basis of internal data, publicly available information and other sources believed to be reliable. The information contained in this article is for general purposes only and not a complete disclosure of every material fact. It should not be construed as investment advice to any party. The article does not warrant the completeness or accuracy of the information and disclaims all liabilities, losses and damages arising out of the use of this information. Readers shall be fully liable/responsible for any decision taken on the basis of this article.